I have a question about something I am working on using abipy to plot DOS but the x axis grid is incorrect as seen below. I am referencing MgB2 fatbands — abipy 0.9.1 documentation link and I am not sure what the error is (abi file is attached too). When I run the plot I get the warning *The input structure does not match the expected standard primitive! The path can be incorrect. Use at your own risk. *
My structure looks like not along symmetry lines. Can anyone shed some light how to fix the issue?
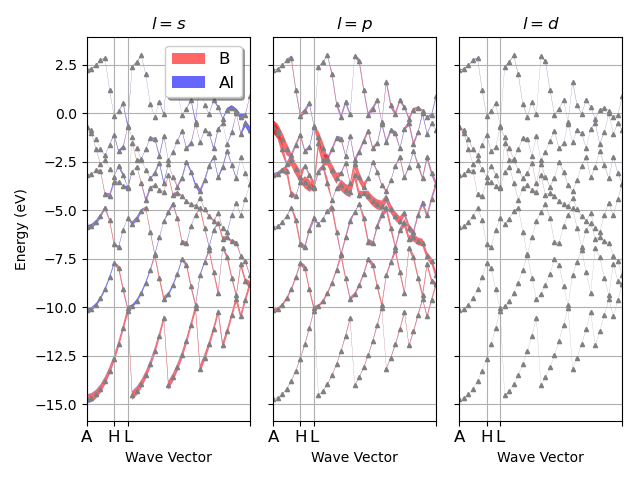
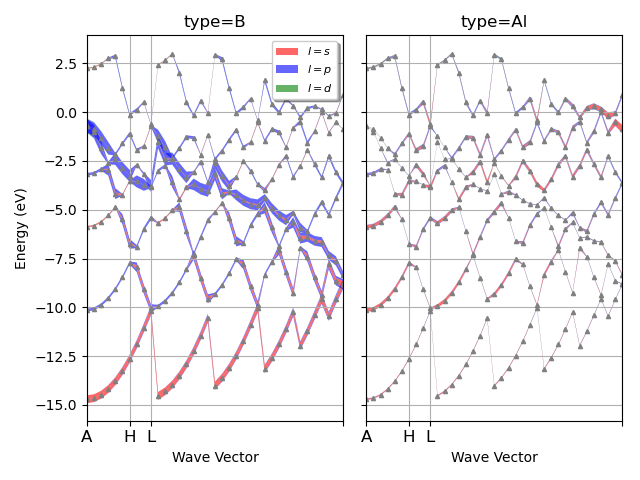
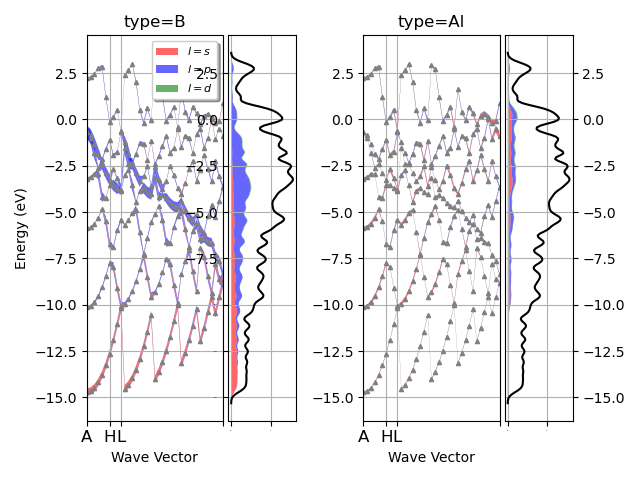
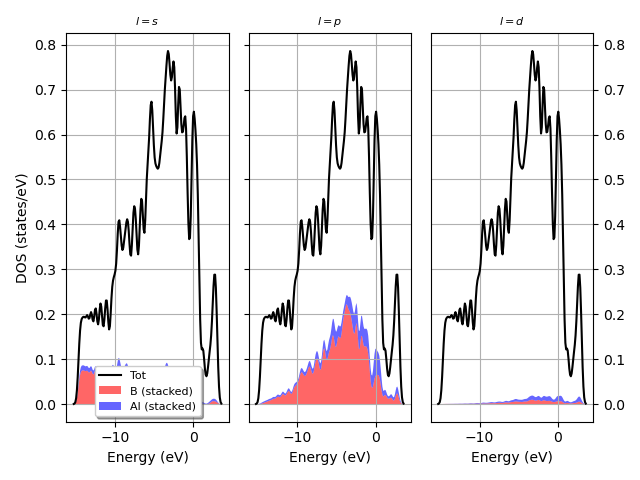
Additionally, I used the following code I linked below that was used to plot the L projected fatbands for MgB2 using prtdos. (MgB2 fatbands — abipy 0.9.1 documentation) Currently I have a monolayer and I was wondering if that makes a difference and how would I modify my code?
I would recommend having 3 datasets in your input file as follows:
ground state SCF calculation to obtain the converged WFK
the usual routine non-SCF dataset in which you recycle WFK/DEN file to calculate the band structure along a desired k-path including the flag for prtdos. With this you can use the FATBANDS file in abipy projected on the k-path that you want. In your files you are just seeing the k-points in the irreducible Brillouin zone on top of which you calculated your electronic eigenvalues.
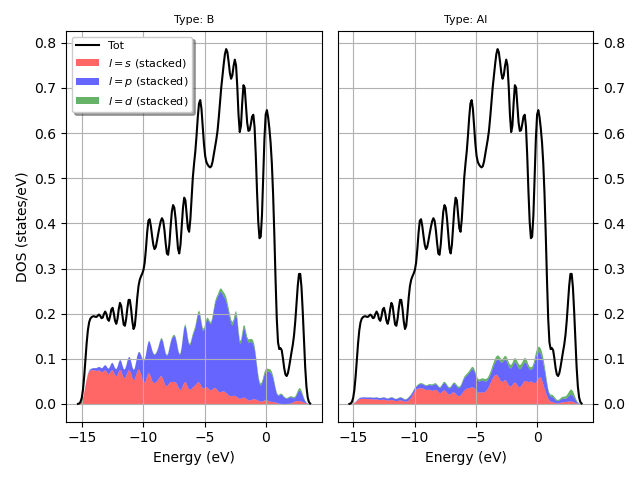
dataset with an enlarged k-point grid in the IBZ in which you calculate the density of states (with or without M decomposition, check prtdosm variable for this). for this keep in mind that in order to have a smooth DOS representation, consider a sensible use of dosdeltae in relation to the kpoint grid.