Hi all,
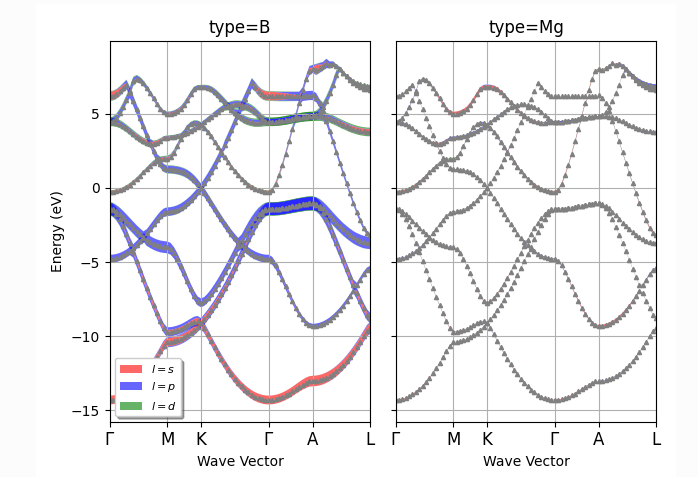
Is there any way to change the plot markers and size while using abipy plotting band structure? Below figure is from abipy document page, I would like to have different marker and size. Is it also possible to select only “d” contribution?
Thanks,
gmatteo
November 15, 2024, 5:54pm
2
To customize the matplotlib marker and its size, use:
fbnc_kpath = abilab.abiopen(abidata.ref_file("mgb2_kpath_FATBANDS.nc"))
fbnc_kpath.marker_spin = {0: "o", 1: "v"}
fbnc_kpath.marker_size = 2
To select only a particular set of l-values, you can change your electrons.fatbands.py module following the changes reported here
Dear gmatteo,
The first part I was doing directly changing on the fatbands.py module, but I had to restart the kernel every time. Your trick saves lot of time!
For the second part, I changed the module accordingly , and I get the result for different selective l-values.
Can I make the similar changes as well for the plot_fatbands_lview or plot_fatbands_mview?
Thanks!
Hi gmatteo,
Can I select one atom in the band structure plot instead both?
Thanks,