Dear Users,
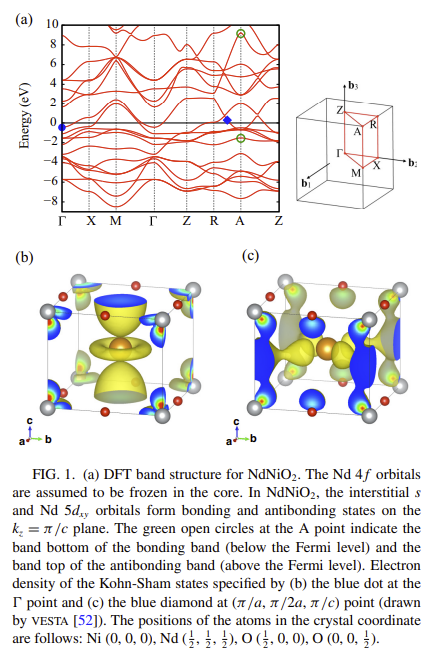
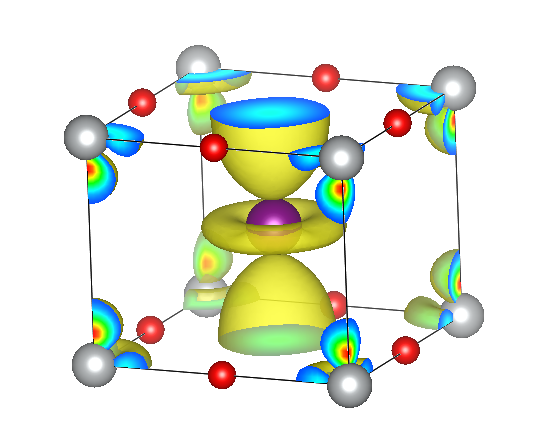
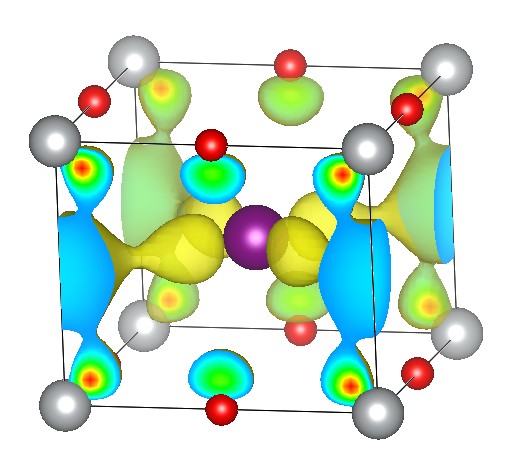
I was wondering if there is some option in abinit to calculate electron density of the Kohn-Sham states at specific k-points in the band structure (like here Phys. Rev. B 100, 205138 (2019) - Formation of a two-dimensional single-component correlated electron system and band engineering in the nickelate superconductor ${\mathrm{NdNiO}}_{2}$ it is done in fig 1)
Maybe Wannier90 can help in this regards?
Regards,
Rajesh
Hi @rajeshatpsi! You can use cut3d on wavefunction files in order to transform them into 3D formatted data in a xsf file that you can then view using tools like vesta or xcrysden. cut3d will then ask you which k-point to use and which band. That way you could view the wavefunction’s real and/or imaginary part for an arbitrary k-point provided you compute it’s wavefunction either from a SCF calculation or a NSCF one. I presume that what the paper you’re referring is plotting the norm of the wavefunctions at these specific points.
Hope this helps
Felix
Dear Felix,
That’s great. Thank you very much. Here is the output from my calculation using abinit.
That means, we can use the WFK file from wannier calculation as well, right?
Regards,
Rajesh
Looks good! Yes you can use wannier90 to show similar stuff. According to their docs (see page 5), you can add the variable wannier_plot = true in the wannier90 input file. This will produce a .xsf file which can be viewed with Xcrysden.
Kind regards,
Félix
Yes, that is, I already checked. What I meant is the following. If we take the input “tw90_6.abi” and compare the WFK files from datasets 2 and 3, it gives similar results. This should be similar as dataset3 takes the wfk file from dataset2. However, In the dataset for wannier, we calculate for one band 3dx2-y2. I thought, for dataset3, we will get such norm of the wave function only for that single band cudx2-y2.