Hi all,
I am trying to calculate the phonon bands for bulk hBN, a relatively simple problem which I’m sure others in the community have probably studied. Most of the bands look fine, except for the optic ones. It looks like I am not getting LO-TO splitting at Gamma when I should be. I will try to be as detailed as possible, because I can’t pin down the problem, and it might be helpful for future reference. Any help/advice would be much appreciated.
Here is the basic system info, after relaxation:
ntypat 2
znucl 5 7natom 4
typat 1 2 1 2acell 4.7267414979E+00 4.7267414979E+00 1.2889229927E+01 Bohr
angdeg 90 90 60 # Angles between vectors 2-3, 1-3, 1-2
xred
0.0000000000E+00 0.0000000000E+00 0.0000000000E+00
3.3333333333E-01 3.3333333333E-01 0.0000000000E+00
3.3333333333E-01 3.3333333333E-01 0.5000000000E+00
0.0000000000E+00 0.0000000000E+00 0.5000000000E+00
I’m using PSML pseudos from pseudo dojo (GGA +vdW correction), and a 12 12 6 k-grid with a shift of 0 0 0. I did a relaxation of the system, keeping the fractional coordinates and cell angles fixed.
relax.abi (2.3 KB)
relax.abo (98.9 KB)
Then I did DFPT calculations for the phonons, treating q = 0 and q =/= 0 separately.
q-zero.abi (3.8 KB)
q-zero.abo (131.5 KB)
For q = 0 I did a phonon perturbation of all of the atoms plus electric field perturbations. All of the calculations look well converged. There are some significant imaginary frequencies here, but they are handled by anaddb and the lower frequency bands all look fine. Note that there is a splitting of about 200 cm^-1 in the [1 0 0] direction here, but anaddb seems to get rid of it later…
For q=/= 0, I ran a non-SCF calculation with a k-grid of 6 6 3 and a shift of 0 0 0 to generate the q-points.
q-nonzero.abi (2.9 KB)
q-nonzero.abo (604.1 KB)
The lowest frequencies are imaginary and fairly large, but the bands from anaddb look good. Then I did mrgddb and ran anaddb to calculate the bands:
mrgddb.abi (425 Bytes)
mrgddb.ddb.abo (221.1 KB)
anaddb.abi (10.3 KB)
anaddb.abo (1.1 MB)
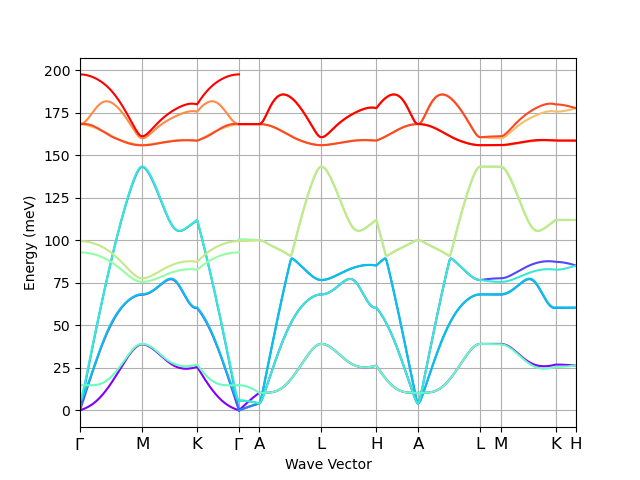
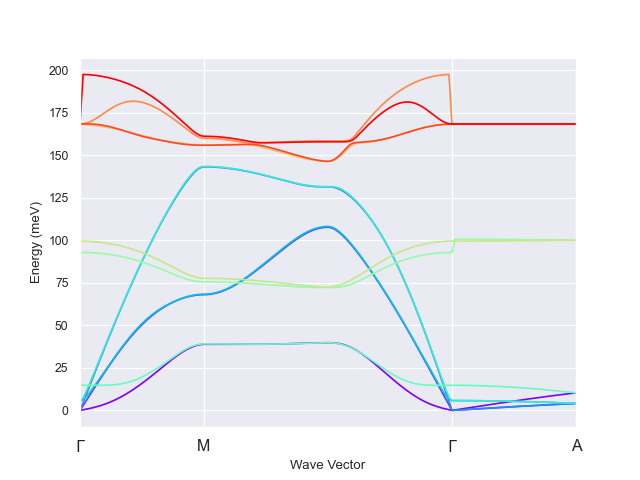
and everything ran fine. I used the q-path: Gamma (0 0 0) - M (1/2 0 0) - K (2/3 1/3 0) - Gamma - A (0 0 1/2). Here is an unformatted plot of the anaddb_PHFRQ file (x axis is qpt number, y axis is Hartree):
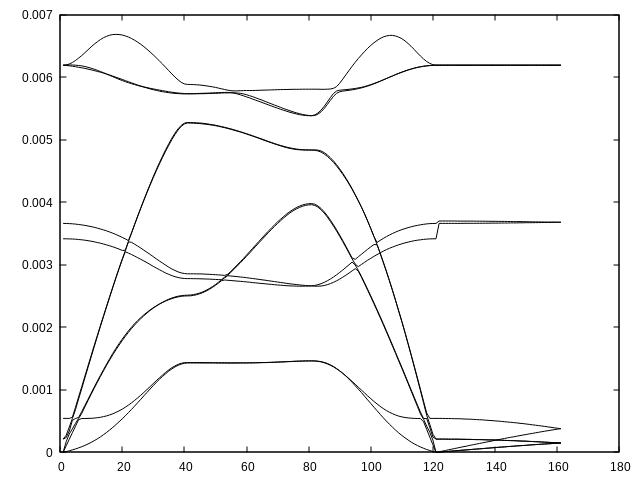
most of the bands look fine, and obviously could be improved by increasing the number of q-points and a finer interpolation. But the top three bands don’t look right. For comparison, see from e.g. here:
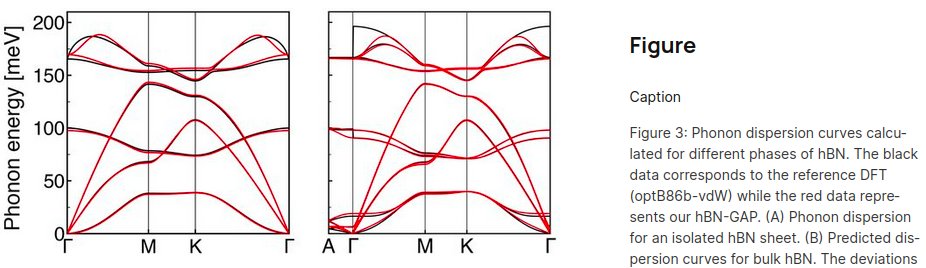
The first plot is for isolated hBN and the second is for bulk.
I think the problem is that there is no LO-TO splitting at Gamma, and it is messing up the interpolation. Strange though, because I clearly saw the splitting in the DFPT calculations. Is anaddb forcing the frequencies to be equal at Gamma?
Any advice greatly appreciated!
Daniel Bennett