Hi,
I have doubted the band structure plot through ABINIT. I have tried to calculate effective mass in xmgrace software via curve fitting. However, there are k-points in the E vs k plot in the band structure plot. I don’t get a plot in the length of k. There is only the scaling of k-points instead of the length between k-points. So, do you know what Abinit’s input variable is ? Then we will find the plot E vs k, where k is not sampling in points but length, like in other software like WIEN2K, VASP, etc.
Hi Vinod,
What exactly do you doubt about the band structure in ABINIT?
If you are interested in calculating the charge carriers’ effective masses, there are several possibilities in ABINIT where one doesn’t need to worry about scaling or other factors:
-
By using DFPT, you circumvent the shortcomings of finite differences and avoid the use of excessive k-points, plus it’s more accurate. Please have a look here EffectiveMass - abinit , you will find some input files as examples for this procedure at the end of the page.
-
If for any reason you want to base your calculations on finite differences, there is a modern and versatile tool directly related to ABINIT called Abipy that allows you to perform this, please have a look here: Effective masses with finite difference — abipy 0.9.1 documentation
The available script is an example of a workflow that automates the calculation of effective masses via finite differences by using ABINIT. All the variables in there can be adapted to your needs.
I would personally invest some time in both approaches.
Good luck,
Bogdan
Thanks for your suggestions. But I want to calculate effective mass through XMGRACE software. Can you have any idea about this?
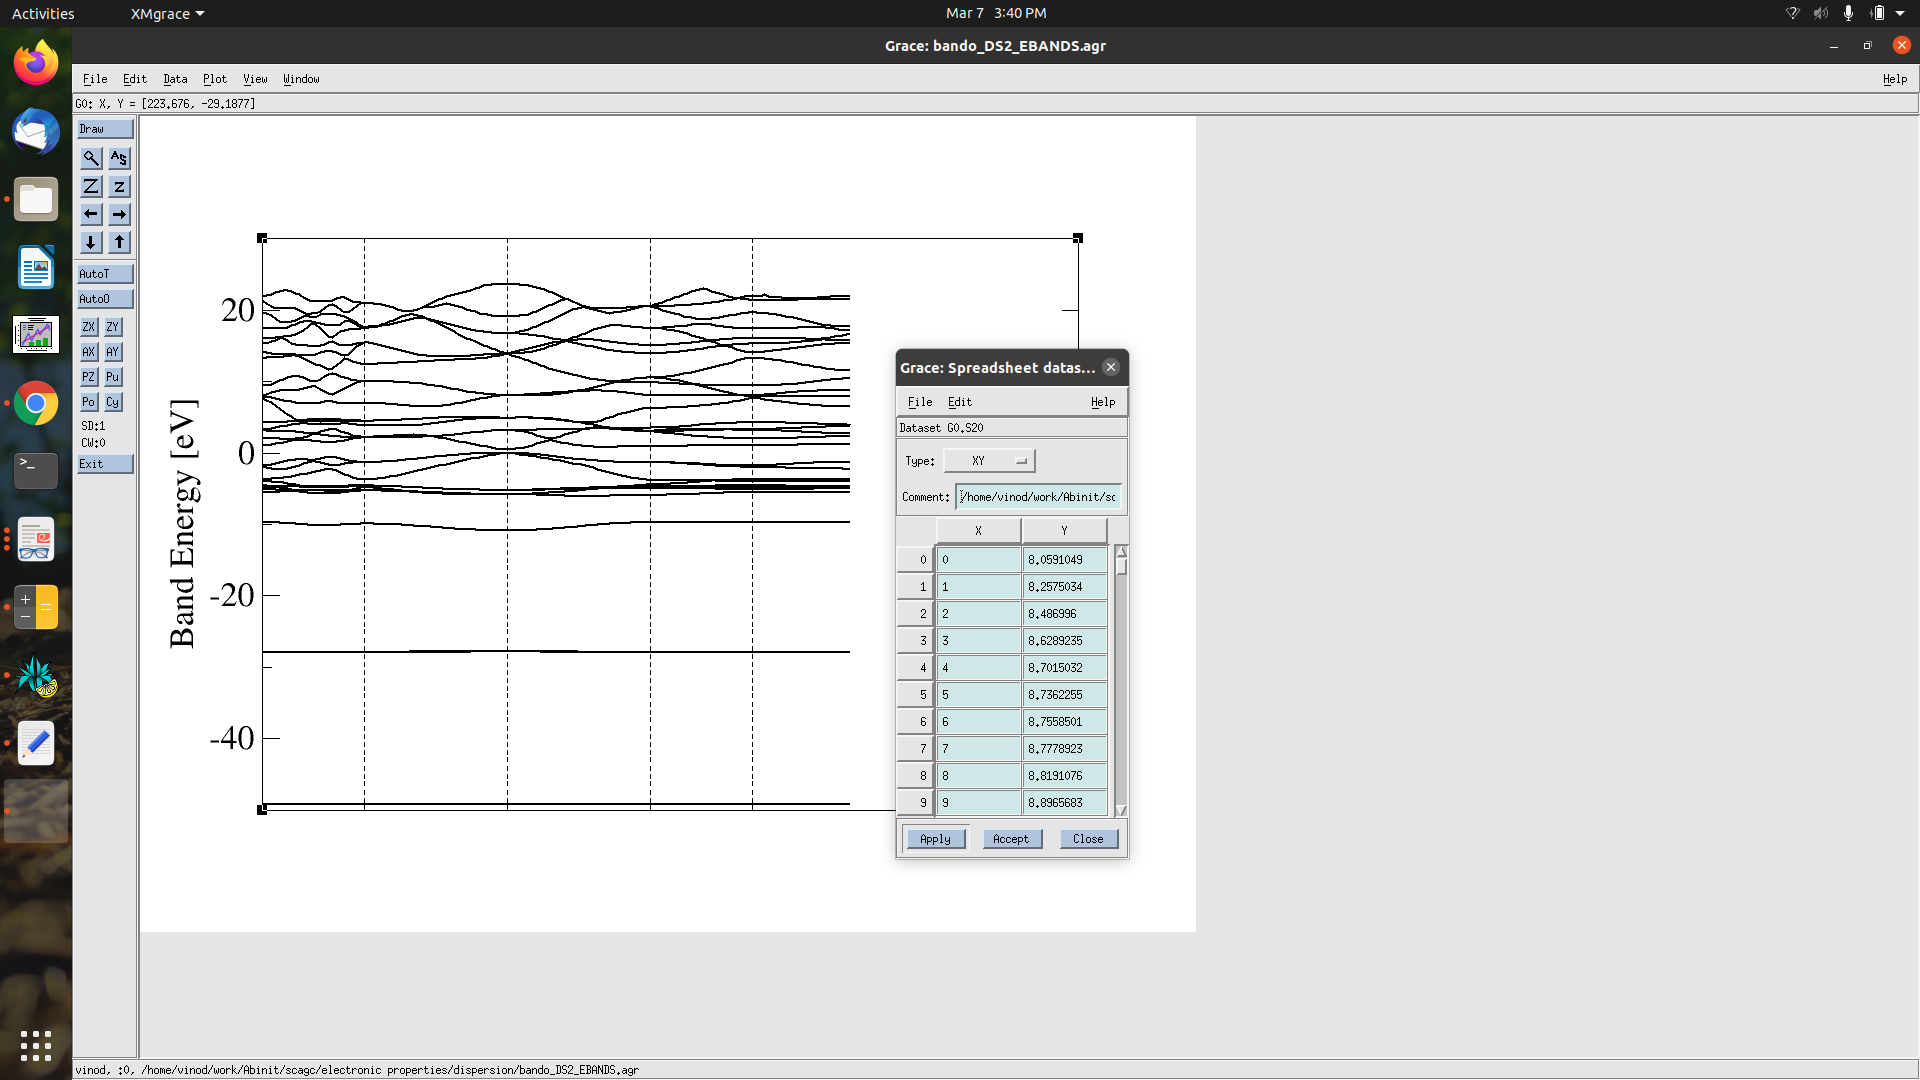
The band structure contains k-points, which means, for example, if we have 10 k-points in a segment, they are sampled into numbers like 1,2,3,…10 and plotted with their corresponding energy. This means the x axis is not plotted into the distance between these points. As you can see in this attached image, for effective mass calculation, we take the derivative of energy with respect to distance. But there are only points in the x-axis instead of the distance between k-points. So, do you know of any command in Abinit that will give me a plot of the distance between k-points like we get from other software like WIN2K?
ABINIT provides the list of k-points in fractional coordinates with respect to the reciprocal lattice vectors, so I would suggest scaling your points with respect to this when using other fitting software.