Dear All,
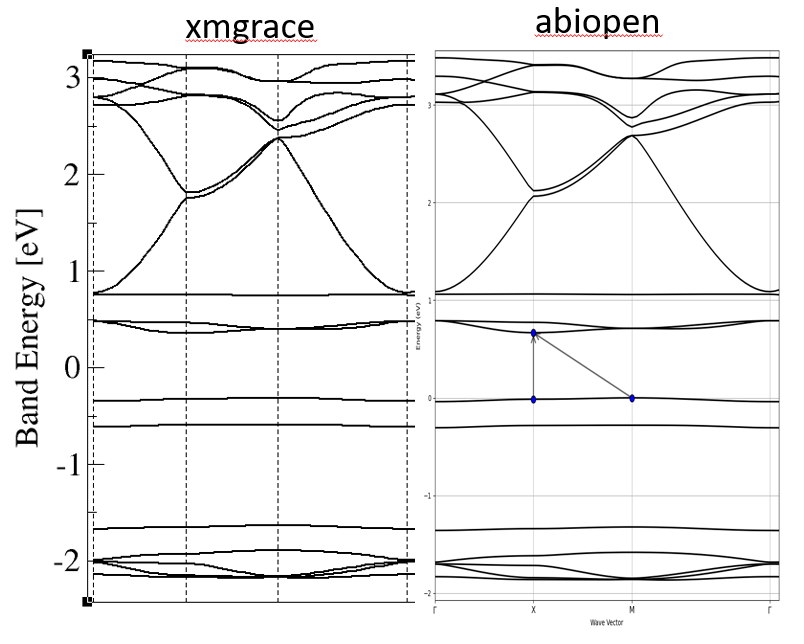
I have notice a difference when I plot the band structure using “name_EBANDS.agr” file in xmgrace and “name_GSR.nc” in abiopen.py, the results are diiferent in the sense of fermi level.
While in abiopen.py the Ef is just top of the valence band and xmgrace plot gives me Ef inbetween the band gap. (screen shot attached)
Any clue why is that so and which one should I take for publishing?
Please let me know and thanks!
R
Hi R,
both are reasonably correct for an insulator. Depending on the occupation scheme you used the value of efermi may be set to the top of the valence band or the middle of conduction. It’s strange the two methods differ, but not a big deal. Either is fine for a paper. Fermi level is not strictly defined in an insulator.
- check in the nc file (see the ncdump command) and log files, to see what value efermi has
- try with metallic occopt (>= 3) and a small smearing (0.001 should be fine) and you should consistently get a Fermi level in the middle of the gap.
- The actual band energies in abinit are referenced to the average electrostatic potential, which is set to 0. This means the value of efermi is important in realigning things.
PS: your bands do look a bit weird, flat and dispersionless (semi-core like) while the upper ones disperse more. You tell us nothing about your stoichiometry etc but you should double check the number of electrons and filled bands is correct wrt your number of valence electrons from the pseudopotentials.
Dear mverstra,
Many thanks for the explanation. I checked the e_fermi = 0.2021 Ha and the occopt was 7 but with bit higher smearing =0.015.
Its Ba2CoGe2O7. The bands between 0.8 to -2.2 (xmgrace plot) represent the Co-3d (should be in total 10 bands for two Co atoms).
regards,
R