Dear all
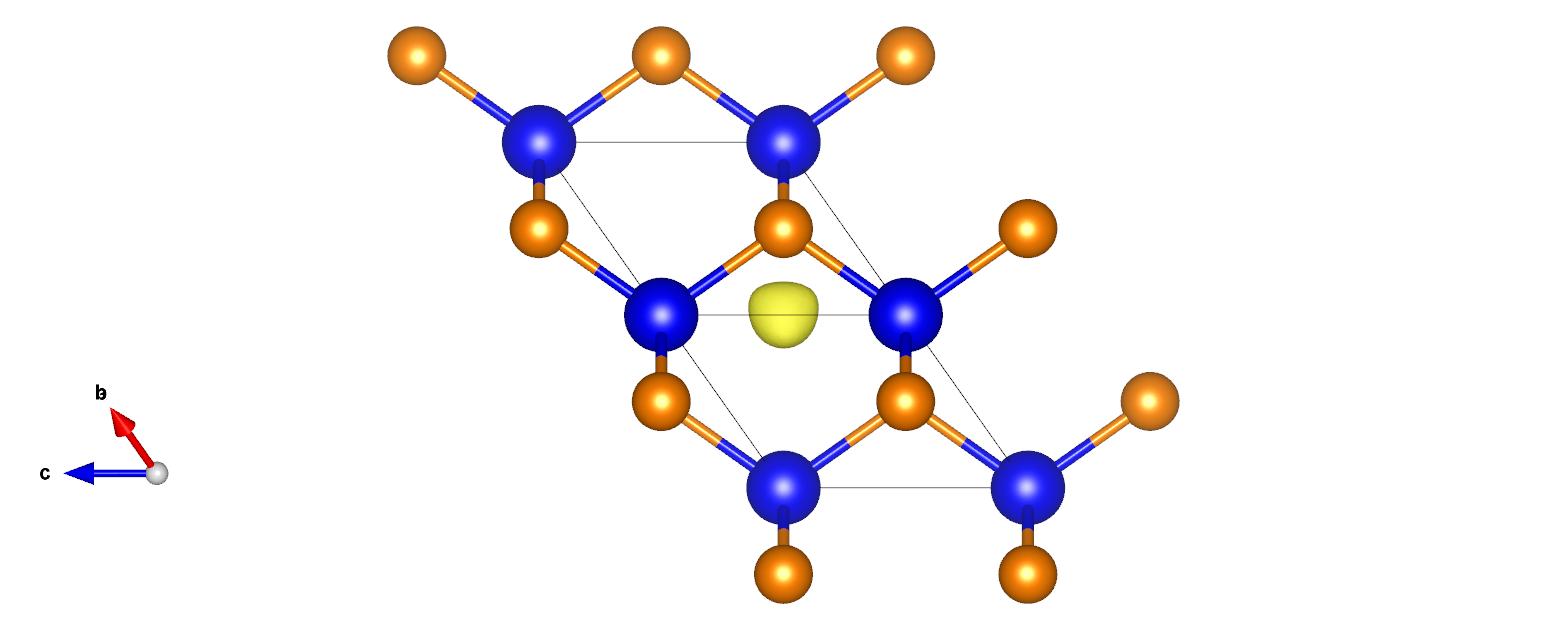
I just performed a usual SCF calculation in GaAs and performed some analysis of the wave function at Gama point. However, I get a weird result for the 9th band, which should be a 5s orbital for Ga atom.
My input parameters are:
ixc 11
mem_test 0
#Scf parameter
iscf 7
nband 20
nstep 200
kptopt 1
nbdbuf 5
#data common to all
nshiftk 1
shiftk 0.0 0.0 0.0
ngkpt 22 22 22
qpt 0.0 0.0 0.0
acell 3*5.66 angstrom
diemac 6.0
ecut 39
natom 2
ntypat 2
rprim
0.0 0.5 0.5
0.5 0.0 0.5
0.5 0.5 0.0
xred
0.000000000 0.000000000 0.000000000
0.250000000 0.250000000 0.250000000
typat 1 2
tolwfr 1d-15
znucl 31 33
Do you have any suggestions? I am wondering whether the problem comes from the visualization. Could you recommend some tools to visualize the wave function?