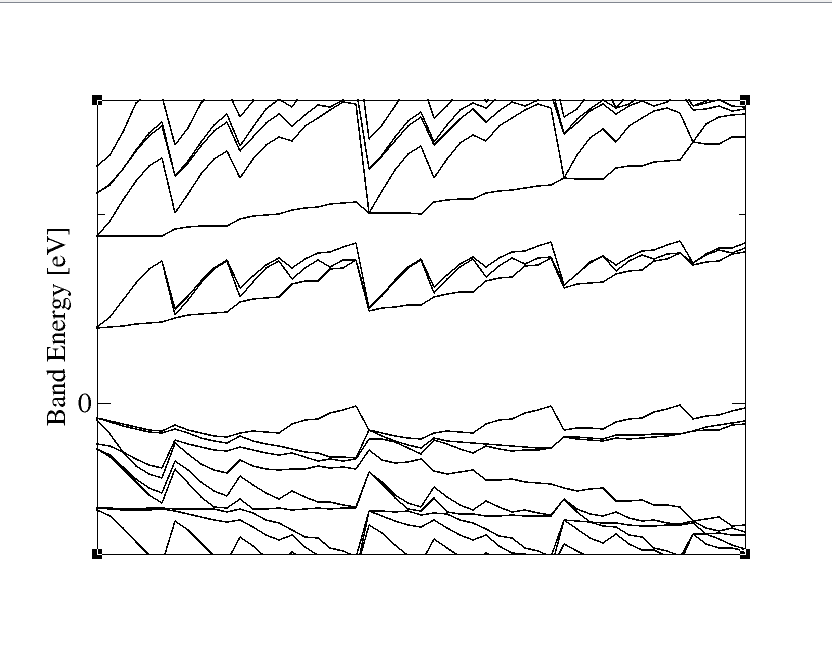
Dear all, I calculated the Band Gap of SrTiO3 with ABINIT, BUT it appear jagged not curve and smoth. Could you please let me know wht this is happining ? The following is my input files :
acell 3.9244716293 3.9244716293 3.9244716293 Angstr
angdeg 90 90 90
nband 30
ecut 34
#chksymtnons=0
nstep 500
toldfe 1.0d-8
ngkpt 12 12 12
prtwf 1
#pawecutdg 60
znucl 8 22 38
ntypat 3
tsmear 0.01
typat 3 2 3*1
natom 5
xred
0.000000000 0.000000000 0.000000000
0.500000000 0.500000000 0.500000000
0.000000000 0.500000000 0.500000000
0.500000000 0.000000000 0.500000000
0.500000000 0.500000000 0.000000000
#############################################3
#Dataset 2 N-SCF calculation
iscf?2 -2
getden?2 -1
kptopt?2 -3
ndivsm?2 20
tolwfr?2 1.0d-12
kptbounds?2
0.0 0.0 0.0 # Gamma
0.5 0.5 0.0 # M
0.5 0.0 0.0 # X
0.0 0.0 0.0 # Gamma
0.5 0.5 0.5 # R
diemac 12.0